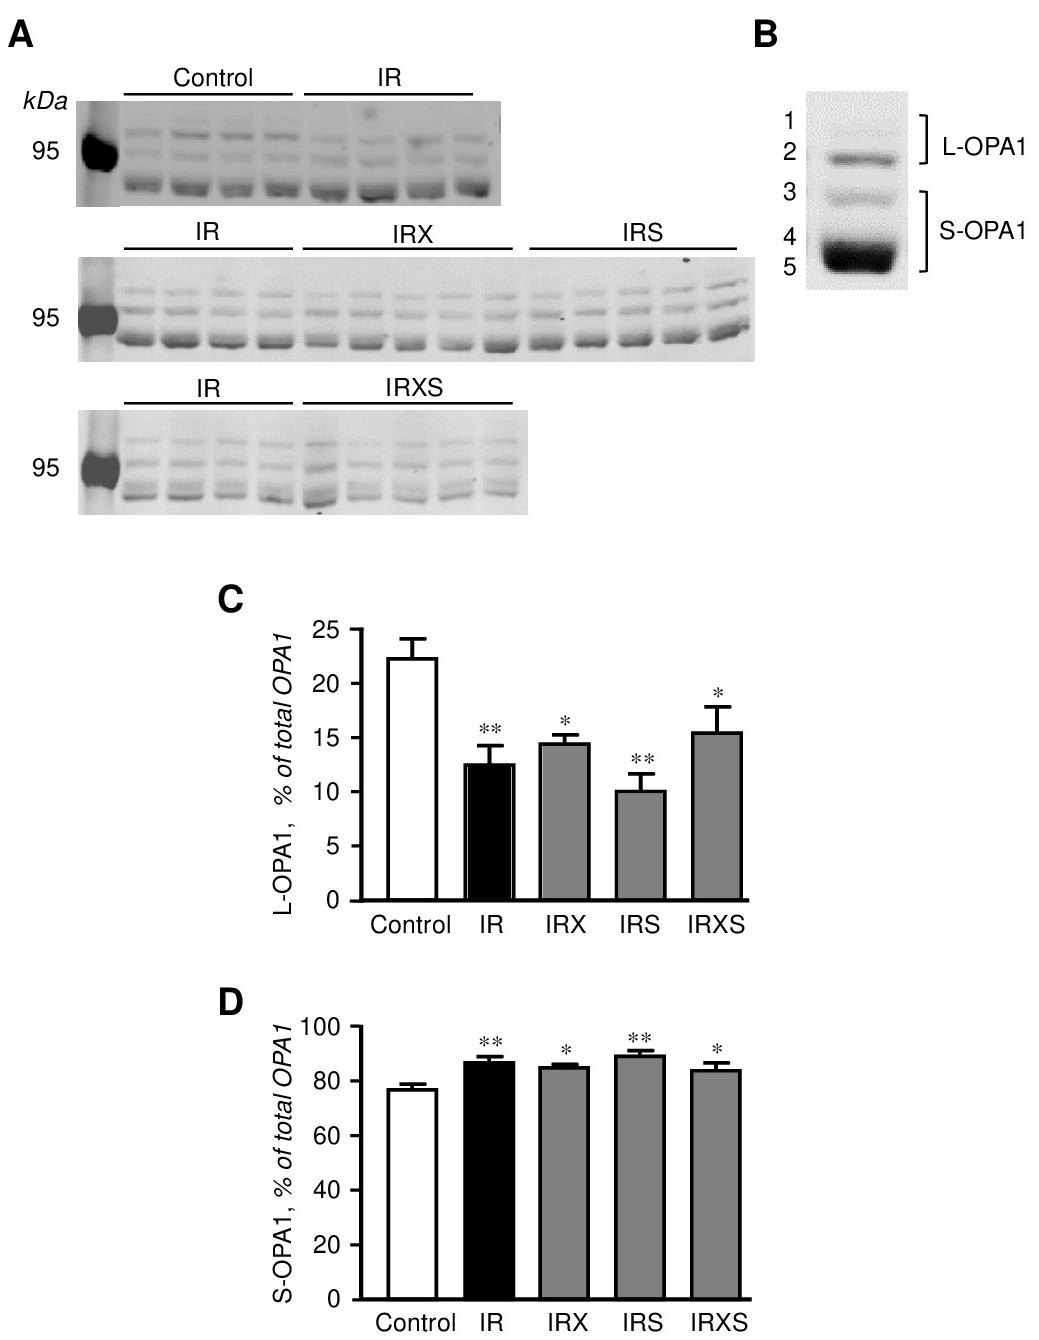
Fig. 5. OPA1 protein levels. A, Representative immunoblots of L-OPA1 and S-OPA1 in mitochondria isolated from control and IR hearts. Mitochondrial samples were run on 3 different gels in the following order: top blot: control and IR (n=4 per group); middle blot: IR, IRX, and IRS (n=4 for IR, n=5 for IRX and IRS); bottom blot: IR and IRXS (n=4 for IR, n=5 for IRX and IRXS). Mitochondrial samples from the same individual IR hearts were run in all 3 gels. OPA1 samples were normalized to the total expression of OPA1. B, Representative immunoblot image showing all five OPA1 isoforms expressed in the hearts. Lines 1 and 2 represent two L-OPA1 isoforms whereas lines 3, 4, and 5 show three S-OPA1 isoforms. C, Quantitative data of L-OPA1. D, Quantitative data of S-OPA1. L-OPA1 and S-OPA1 levels were calculated based on densitometry analysis using LI-COR Image Studio Lite. OPA1 levels were calculated as the proportion of L-OPA1 (C) and S-OPA1 (D) to the total OPA1 (L-OPA1+S-OPA1). Groups: Con, control; IR, ischemia-reperfusion; IRX, IR+XJB; IRS, IR+SfA; IRXS, IR+XJB+SfA. *P<0.05, **P<0.01 all groups vs. Con. n=4-5 per each group.